2019 Milestones: Year in Review Infographic
Wow, what a year 2019 has been! As we neared the end of the year and got ready to wrap things up, the team here at Guidebook dove into the data – and boy were you busy. From Guides for one-day conferences and meetings to Guides for trips and ongoing trainings, we saw more unique Guides than ever before.
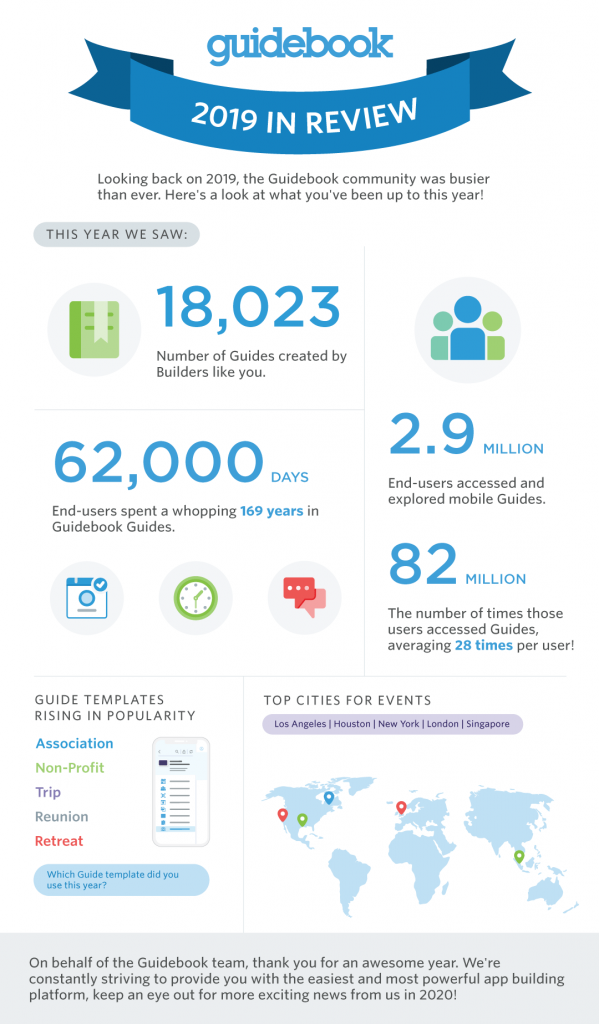
Here are a few exciting highlights, let’s look at what we achieved together!
Let’s dive into the facts and figures from this year!
Guides Created and Accessed
Our community of builders created over 18,023 new Guides this year!
Once published, 2.9 Million of your end-users accessed and explored mobile Guides 82 million times – that’s an average of 28 times per user! Additionally, your users spent 62,000 Days or 169 years in Guidebook Guides. Wow, that’s a lot of audience participation. How are you planning to increase your attendee engagement next year?
Guide Templates Rising in Popularity
While conferences made up a large percentage of the events powered by Guidebook, this year we saw an interesting shift. Small group events like retreats and trips gained in popularity and many organizers moved their communication and information onto digital platforms. The top 5 templates rising in popularity were:
- Association
- Non-Profit
- Trip
- Reunion
- Retreat
Top Global Cities for Events
It may come as no surprise, many of the largest US cities are also event hubs and lead the pack as the most popular cities for events. International hubs–London and Singapore–round out the list, giving us a full picture of the most frequent event locations. Was your event in one of the top five cities?
- Los Angeles
- Houston
- New York
- London
- Singapore
On behalf of the Guidebook team, thank you for an amazing year. We’re constantly striving to provide you with the easiest and most powerful app building platform, keep an eye out for more exciting news from us in 2020!